Master Candlestick Patterns
Mastering candlestick patterns is essential for any trader looking to understand market sentiment and price action through technical analysis. These visual representations of price movement, popularized as Japanese candlesticks, provide critical clues about bullish and bearish momentum. By identifying reliable reversal patterns like the Hammer, Shooting Star, Morning Star, and Evening Star, traders can anticipate shifts in trend direction. Conversely, continuation patterns such as Bullish and Bearish Flags or Rising Three Methods help confirm that an existing trend remains intact. Professional traders often look for high-probability signals like the Bullish Engulfing or Bearish Engulfing candle at key support and resistance levels to improve their risk-to-reward ratio. Whether you are day trading, swing trading, or analyzing long-term stock charts, integrating candlestick charting with indicators like volume or RSI can significantly enhance your trading strategy and accuracy.
Introduction to Candlestick Types and Patterns
Candlestick charts are the most popular tool for visualizing price action and understanding market psychology in modern trading. Originally developed by Japanese rice traders, these charts provide a detailed look at price movements over a specific timeframe, showing the open, high, low, and close (OHLC) prices. Unlike simple line charts, Japanese candlesticks use a “body” and “wicks” (or shadows) to illustrate the battle between buyers and sellers. Learning to read these charts is a fundamental skill for technical analysis, as they reveal the strength of a trend and the potential for a trend reversal. Whether you are a beginner or an advanced trader, mastering the anatomy of a candlestick is the first step toward predicting future price direction with confidence.
Types of Candlesticks : Understding of Bullish & Bearish Candles
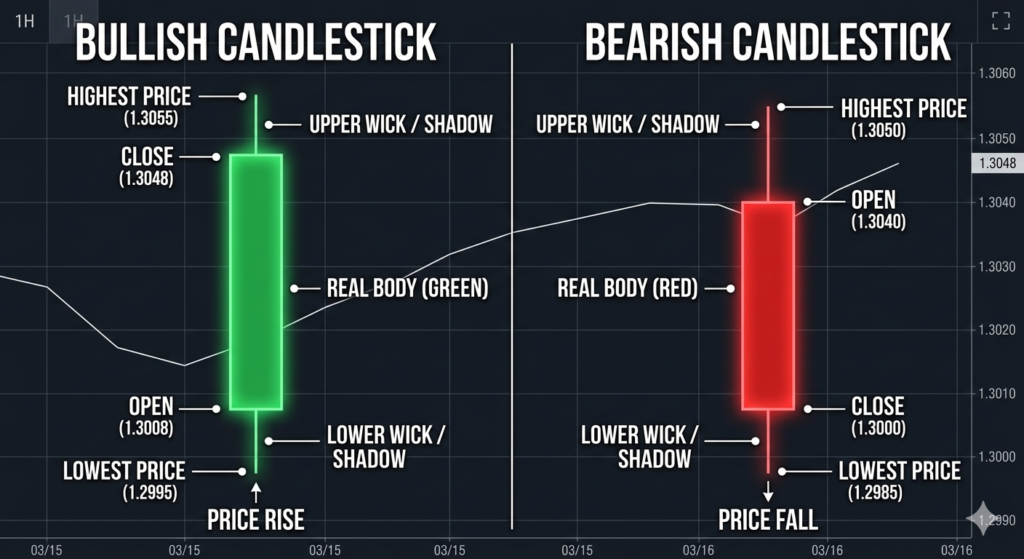
The anatomy of a candlestick is a fundamental concept in technical analysis, providing a visual representation of price action over a specific timeframe. Each candlestick consists of a central real body and thin lines called wicks or shadows extending from the top and bottom. The body illustrates the price range between the opening and closing quotes; a green or hollow body signifies a bullish trend where the price rose, while a red or filled body indicates a bearish move where the price fell. The wicks represent the intra-period highs and lows, offering critical insights into market volatility and the tug-of-war between buyers and sellers. By mastering these four data points—Open, High, Low, and Close (OHLC)—traders can identify high-probability patterns, gauge market sentiment, and make data-driven decisions in volatile financial markets like Forex, stocks, and cryptocurrency.
Key Components for Your Strategy
- Real Body: Shows the net price change from start to finish.
- Upper Wick: Marks the peak resistance level reached.
- Lower Wick: Highlights the maximum support found during the session.
- Color Coding: Instantly identifies market dominance (Bullish vs. Bearish).
Types of Bullish Candlesticks
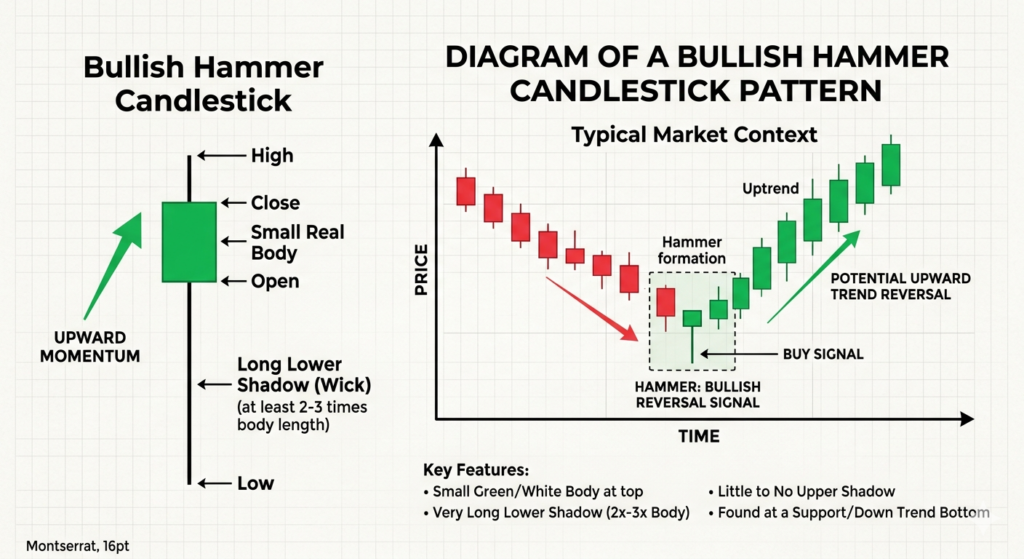
- A Bullish Hammer is a single-candle reversal pattern that signals the potential end of a downtrend and the start of a new upward move.
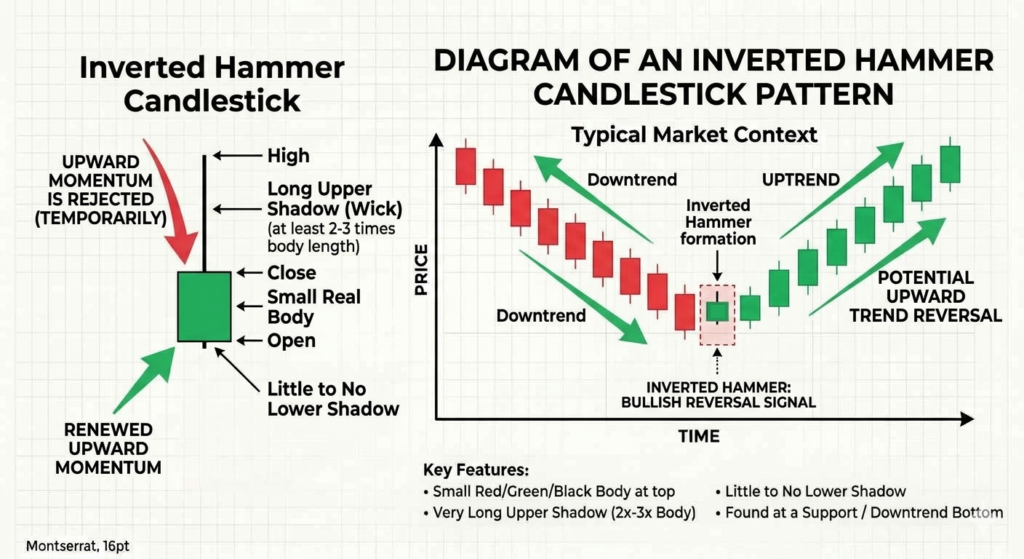
- The Inverted Hammer is a common bullish reversal candlestick pattern that occurs at the bottom of a downtrend. It features a small body at the lower end of the trading range with a long upper wick, resembling an upside-down hammer.
Types of Bearish Candlesticksticks
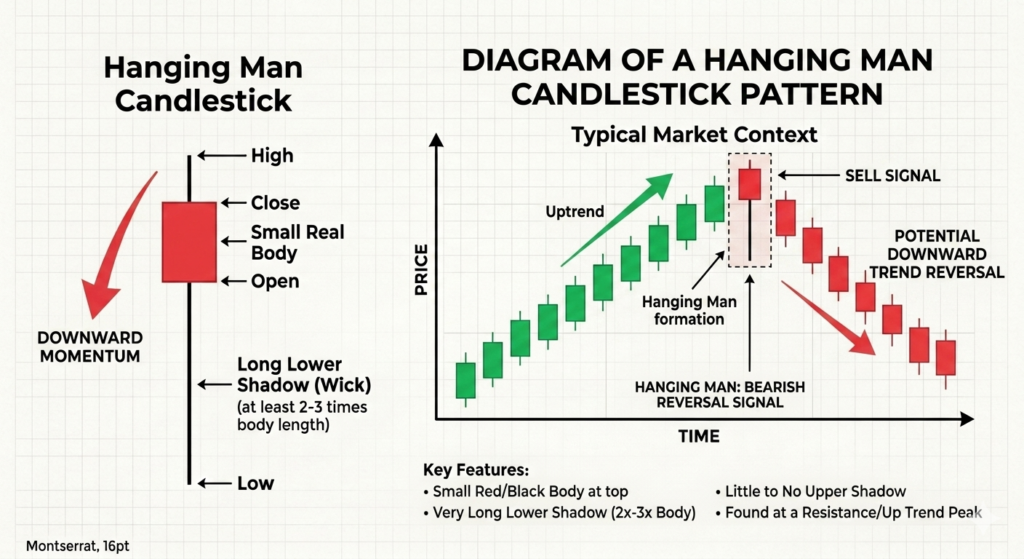
- The Hanging Man is a bearish reversal pattern that looks identical to the Bullish Hammer but appears at the top of an uptrend. It signals that despite buyers’ efforts, selling pressure is starting to overwhelm the market.
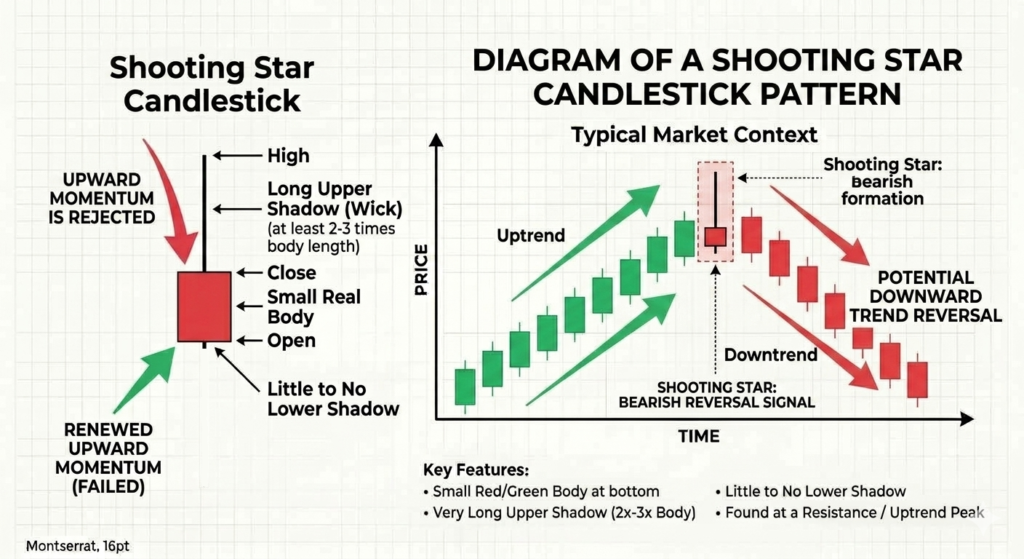
- The Shooting Star is a bearish reversal candlestick pattern that occurs at the top of an uptrend. It is the visual opposite of the Hammer and indicates that buyers are losing control to sellers.